
Link to original article:The state of unicorns in 7 charts
We visualize the billion-dollar club and break down valuation and headcount trends by industry, geography, and more.
The venture boom of 2021 and early 2022 sent tech valuations through the roof, driving the number of billion-dollar private companies to over 1,200.
However, in the quarters since, venture deals and dollars have fallen to the lowest levels in years, and VC FOMO is firmly in the rearview mirror.
This has had a dramatic effect on the rate of new unicorn births, with Q3’23 seeing just 12 new unicorns — the lowest birth count in over 6 years.
Below, we dig into the global unicorn club across the following charts:
- A market map of all 1,220 unicorns
- Distribution of unicorns by industry
- Distribution of unicorns by geography
- The industries seeing the greatest share of new unicorns
- Median unicorn valuation by industry
- Unicorn headcount trends by industry
- Top unicorn investors
Market map
Collectively, the world’s unicorns are worth $3.8T — roughly the value of Amazon, Meta, and Google combined.
The market map below shows all 1,220 unicorns, grouped by industry.
Categories are not mutually exclusive and companies are sorted by primary use case.
Unicorns by industry
Enterprise tech is the most highly represented industry, with 30% of all unicorns. The enterprise tech category includes tech companies that target general B2B use cases or sell into a wide range of industries.
Given the breadth of this group, we’ve broken it down further into segments like HR tech, cybersecurity, and data management, which each account for 5% of all unicorns.
The financial services industry takes the second spot with an 18% share, followed by consumer & retail with 17%.
The most highly valued unicorns in each industry are:
- Enterprise tech: Databricks ($43B)
- Financial services: Stripe ($50B)
- Consumer & retail: SHEIN ($66B)
- Industrials: SpaceX ($150B)
- Healthcare & life sciences: Devoted Health ($12.6B)
- Media & entertainment: ByteDance ($225B)
- Insurance: Howden Group Holdings and Coalition (tied at $5B)
Global distribution of unicorns
Globally, a total of 52 countries and regions are represented in the unicorn club.
The US is home to more than half of all unicorns (53%). Within the US, two industries are better represented than the global average: enterprise tech (38% of US unicorns) and healthcare & life sciences (14% of US unicorns).
The US is followed by China (14% of global unicorns). China’s unicorns are especially concentrated in the industrials and consumer & retail spaces, which represent 32% and 29% of the country’s unicorns, respectively.
However, China is seeing fewer new unicorns than it has historically. It contributed just 5, or 8%, of the 59 unicorns born in the last year (as of 10/19/23). The UK surpassed China during that window with 6 new unicorns, or 10%.
Fifty-nine new unicorns have been born in the last year (as of 10/19/23).
Within this cohort, two industries have been minting unicorns at a higher-than-average rate: enterprise tech (20 new unicorns, or 34% of the total) and industrials (13 new unicorns, or 22%).
Over the last year, a new technology category has had an outsized impact on the enterprise tech industry: generative AI.
More than a third of enterprise tech unicorns born in the last year are genAI companies. This includes core AI tech developers like Cohere and Adept, as well as recent additions like AI21 Labs, Imbue, and Zhipu AI. It also expands to areas like marketing & ad tech (Typeface), development (Replit), and employee training (Synthesia).
These companies are also reaching unicorn status at a faster pace. Globally, the average time to reach a $1B+ valuation is 7 years. But these genAI companies have done it in just 4 years on average.
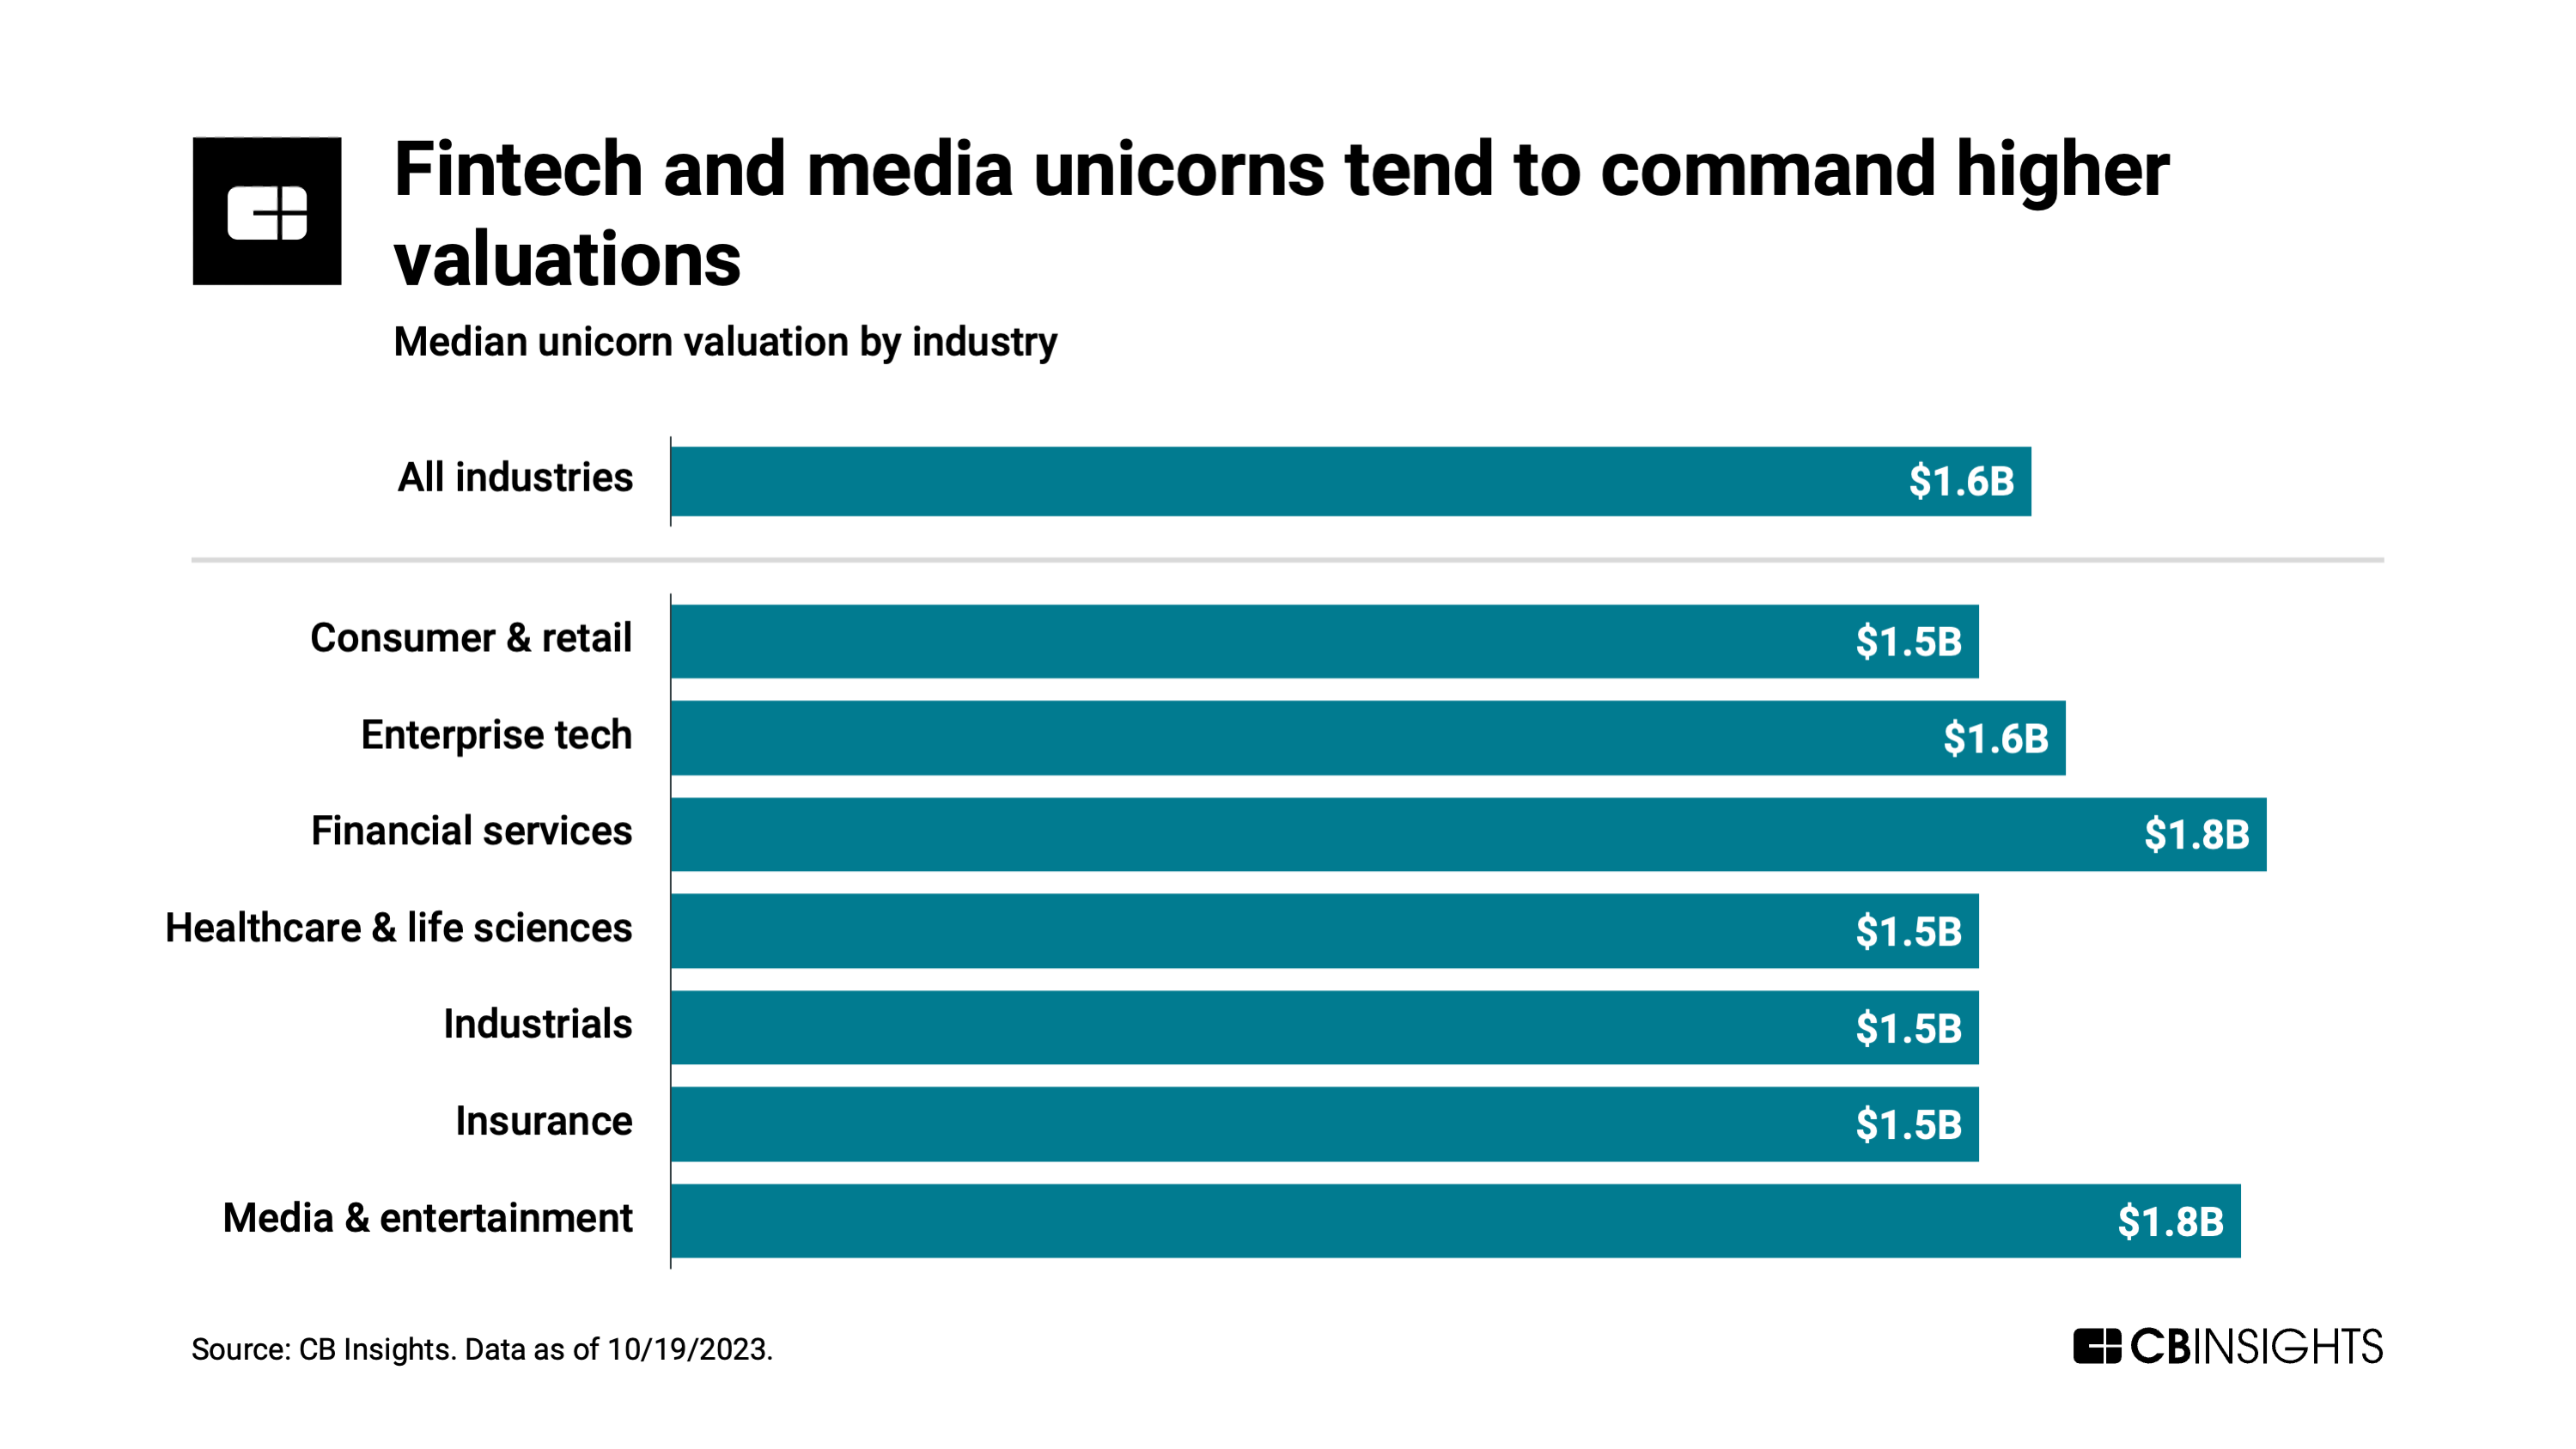
Median valuation by industry
Less than 5% of unicorns hold valuations north of $10B — and just 2 have been able to reach (and hold onto) a $100B+ valuation.
The majority of unicorns are valued at $2B or less, with the median valuation clocking in at $1.6B.
However, this median scales up or down depending on the industry. For example, unicorns in the financial services and media & entertainment industries have a higher median valuation ($1.8B) compared to others.
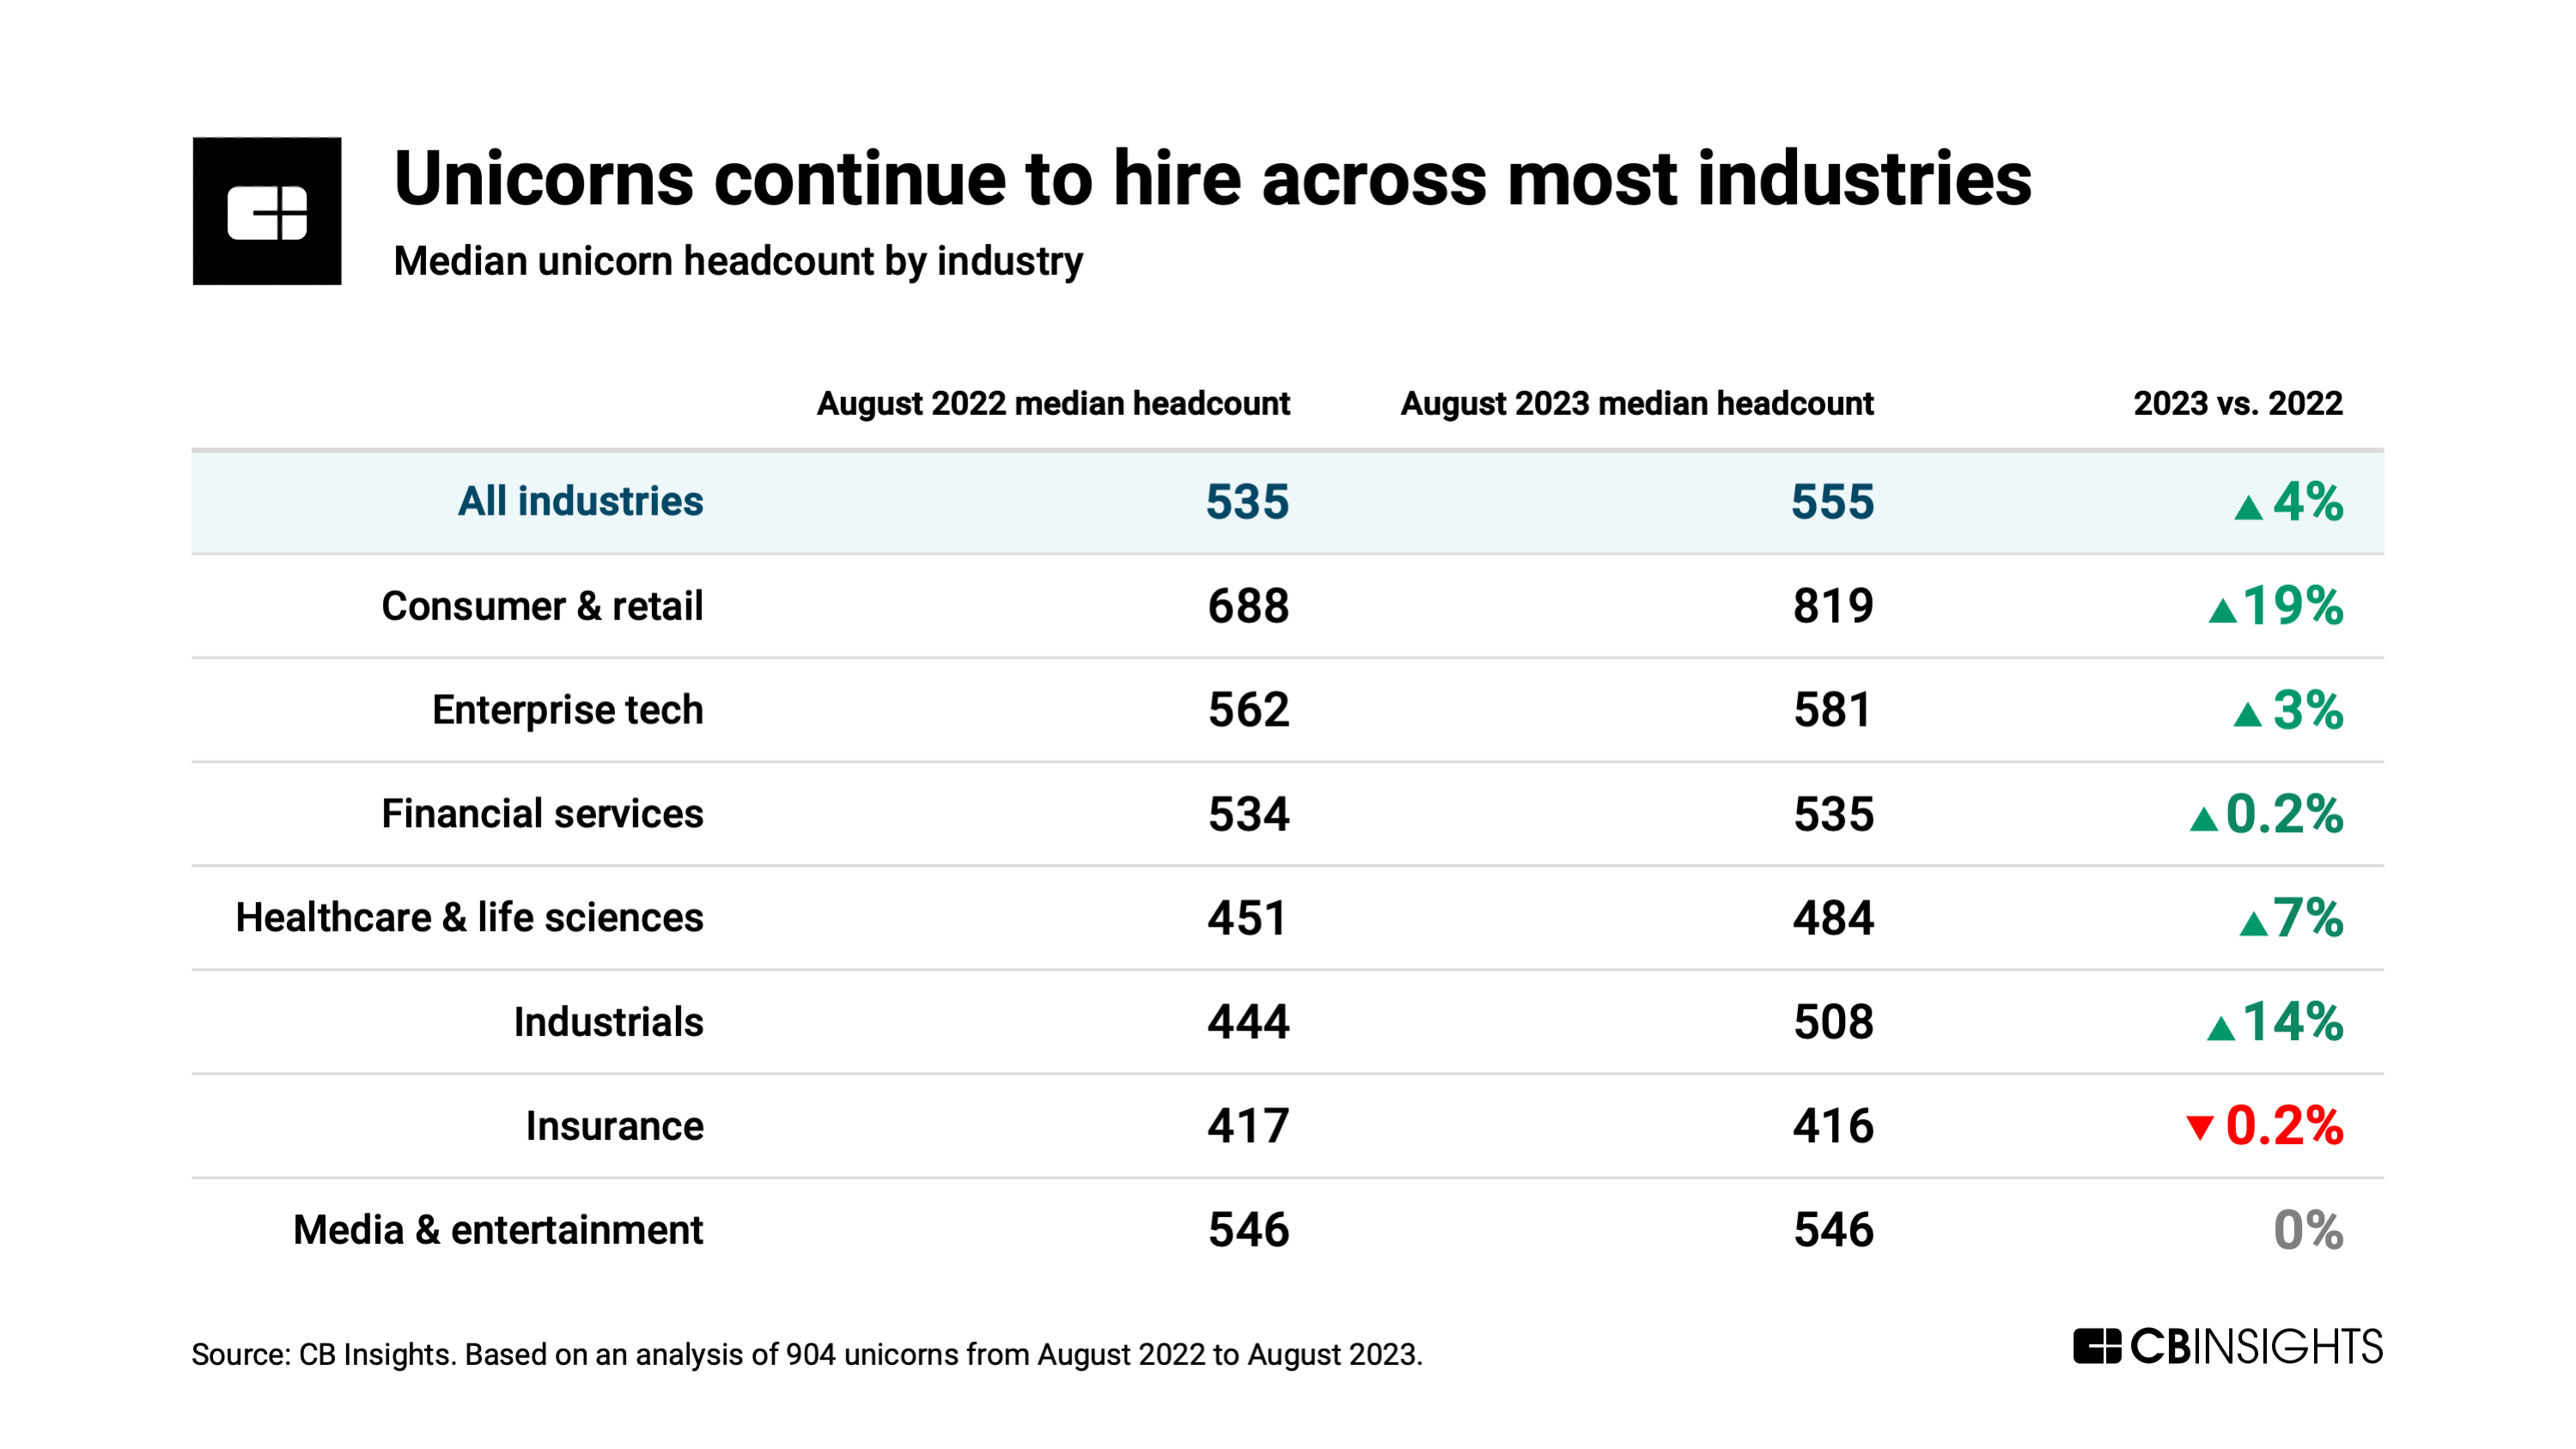
Unicorn headcount trends
Despite the waves of layoffs seen around the tech ecosystem, unicorns have largely continued to hire over the past year. In fact, the median headcount has grown across almost every industry in our analysis.
Many of these unicorns fundraised heavily in the years prior, which could explain the continued workforce growth. However, as the venture downturn continues to dry up available capital, many of these unicorns may soon need to prioritize efficiency over growth. This could slow or even reverse the headcount growth we’ve seen from these companies.
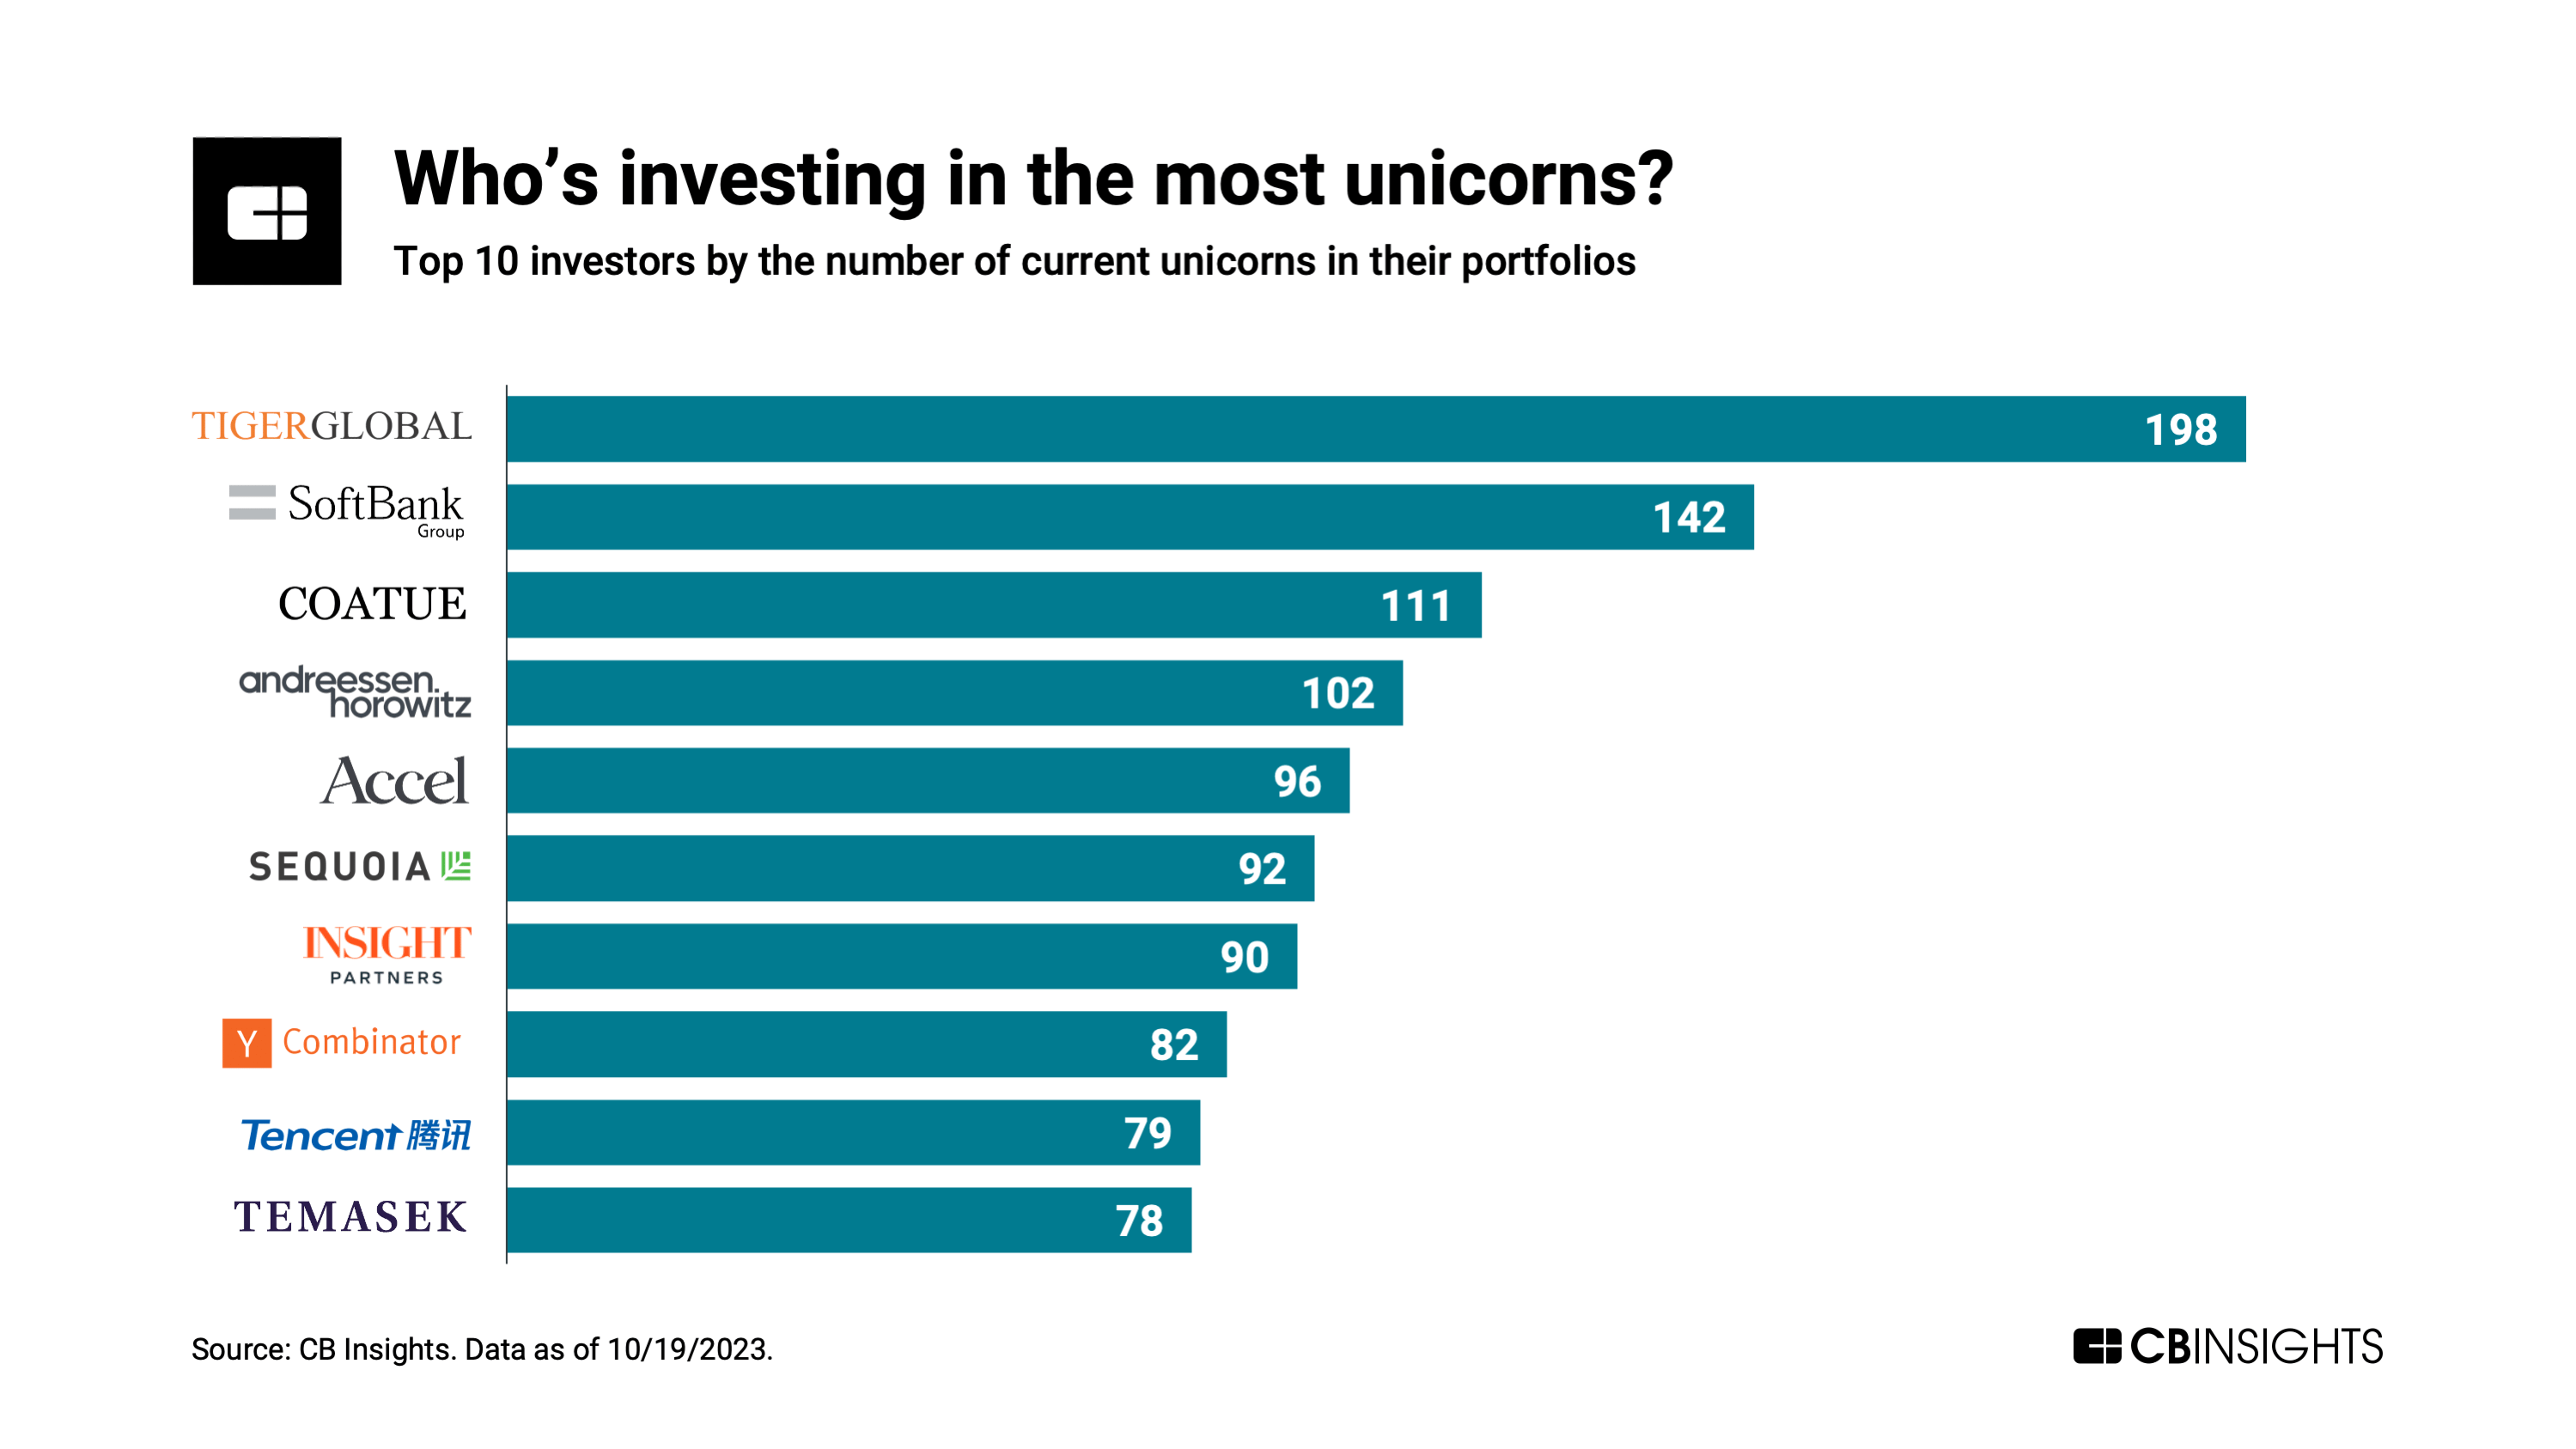
Top unicorn investors
There are more than 7,400 investors with equity stakes in the current unicorn club.
However, a handful of investors lead the pack — in some cases, by a significant margin.
Tiger Global, for instance, counts nearly 200 unicorns in its portfolio. It has historically focused on large, late-stage investments, often investing in companies even after they’ve become unicorns.
However, Tiger has faced significant losses in its public-market funds, and some of the most valuable unicorns in its private-market portfolio have seen their valuations fall dramatically in down rounds.
For more on top unicorn investors, see our full analysis here.